How much do solar panels cost? The honest answer depends on location, roof design, system size, equipment, labor, financing, and available incentives. A typical U.S. homeowner may see thousands of dollars before tax credits, not a simple panel-by-panel price. Panels are only one part of the purchase. Inverters, mounting hardware, permits, installation labor, and battery storage can change the final invoice.
Recent industry research helps establish a realistic starting point. The National Renewable Energy Laboratory’s 2024 residential benchmark places installed solar costs at roughly $3 per watt before incentives, although regional prices vary sharply. EnergySage’s 2024 Solar & Storage Marketplace data also shows meaningful differences between installer quotes and system designs. Lazard’s Levelized Cost of Energy report indicates that utility-scale solar remains among the lowest-cost new electricity sources. That does not automatically make every home installation inexpensive.
As Fatih Birol, Executive Director of the International Energy Agency, said, “Solar PV is now the cheapest source of electricity in history.” The IEA published this observation in its Renewables 2020 analysis. It describes solar’s falling generation cost, not your exact rooftop quote. That distinction matters.
A fair comparison should include cash price, financing charges, expected production, warranty coverage, and maintenance. Ask for the price per watt. Check whether the proposal includes roof repairs and permitting. Battery storage deserves separate scrutiny. It can improve resilience, but it may lengthen the payback period.
There is no perfect average.
This guide will examine how much do solar panels cost, where the money goes, and which assumptions deserve a second look. Some estimates will feel uncomfortable. That is useful, because a low quote can hide missing services.
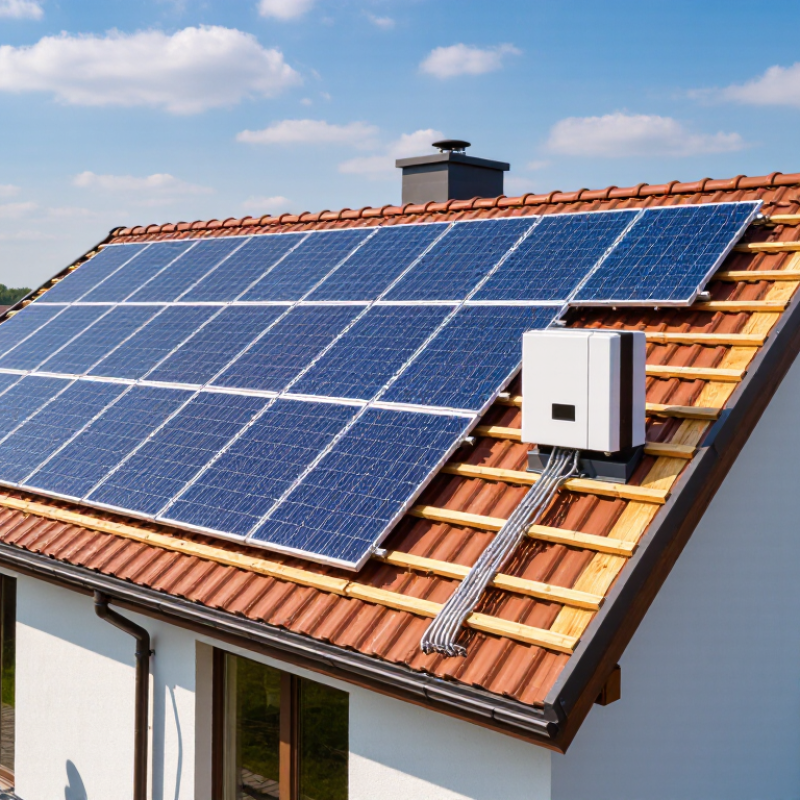
Solar panel cost is not a simple price per panel. The final figure reflects system size, equipment, labor, and site conditions. A typical home may need 15 to 25 panels, but electricity use matters more than roof area. Higher-efficiency panels can reduce the required space. They may cost more.
Roof shape changes installation time. A south-facing, unshaded roof is usually easier to design. Trees, vents, steep slopes, and fragile roofing can add labor. An on-site inspection should check structural strength, wiring routes, and the main electrical panel. Battery storage adds a separate cost. So does monitoring equipment. Permits and local inspection fees may also appear. Get these items listed separately. Otherwise, a low quote can feel misleading.
Quotes should show equipment, labor, warranties, expected production, and estimated payback. Ask how production was calculated, especially during winter or cloudy months. Incentives can reduce the upfront price, but rules change. Confirm them through current government or utility sources. The honest answer is less tidy. No estimate is exact. Future roof repairs, tree growth, and electricity-rate changes can alter savings. I would compare at least three detailed proposals, not just headline prices. Cheap is not always economical. Check the assumptions.
Estimating solar panel costs starts with sizing the system correctly. Review your electricity bills from the past 12 months, not just one summer bill. Find your average monthly usage in kilowatt-hours (kWh). A home using 900 kWh monthly needs more capacity than one using 500 kWh.
Divide annual usage by your location’s average peak sun hours and system efficiency. For example, 10,800 kWh yearly usage, 1,400 peak sun hours, and 80% efficiency requires about 9.6 kilowatts of solar capacity. Panel output, roof direction, shade, temperature, and local weather can change this estimate. A professional site assessment should confirm the result. I have found that shaded chimneys and older wiring often make simple online calculators too optimistic. That part deserves careful checking.
Tips: Add expected future loads, such as an electric vehicle or heat pump. Measure usable roof space before choosing panel quantity. Leave room for maintenance access. Ask for itemized pricing, including permits, labor, electrical upgrades, and optional battery storage. Solar costs usually rise with system size, but a larger system is not automatically better. Your roof may fit twelve panels, yet your electricity use may justify only eight. Estimates can be imperfect. Use them as a planning tool, then compare them with recent utility bills and an independent installer’s proposal.
Solar installation cost is not just the price of the panels. A complete quote usually includes panels, an inverter, mounting rails, wiring, and safety equipment. Labor is another major expense. Certified installers must secure equipment, connect circuits, and test system performance. A careful site assessment should also be included. It checks roof condition, shade, orientation, and available electrical capacity.
Permits, design drawings, utility applications, and inspections can add smaller charges. They are easy to overlook. Some homes need an upgraded electrical panel or new wiring before installation. Older roofs may require repairs or replacement first. These costs can change the project substantially.
I have seen estimates appear affordable until roof preparation was listed separately. Ask whether removal, disposal, scaffolding, and final cleanup are included.
Optional equipment creates another cost layer. Batteries, monitoring devices, backup circuits, and smart controls may increase the initial price. Financing can also add interest, administration fees, or early repayment conditions. Maintenance is usually limited, but cleaning, inverter replacement, and occasional inspections should remain in a long-term budget. Tax credits and local incentives may reduce costs, but eligibility rules differ by location and can change. Request an itemized proposal with equipment quantities, labor charges, warranties, permit fees, and expected electricity production. Then compare similar system sizes, not only headline prices.
The advertised solar price rarely shows the full financial picture. Your roof size, electrical panel, shading, and battery needs can change the quote. I have seen two nearby homes receive very different estimates for similar systems. A written proposal should separate equipment, labor, permits, maintenance, and optional storage. Ask how production was calculated. Weather and tree growth can make predictions imperfect.
Incentives may reduce the final cost, but eligibility rules require careful checking. Federal, state, and local programs can differ by income, property type, installation date, and system size. Some benefits reduce taxes, while others arrive as rebates or utility credits. Do not treat a promised incentive as guaranteed cash. Check official government or utility information, then confirm the requirements with a qualified installer or tax professional. Keep every invoice and approval document.
Financing can make solar feel affordable while increasing the total amount paid. Compare the annual percentage rate, loan term, dealer fees, and early-payment conditions. A low monthly payment may hide a twelve-year commitment. Cash purchases often have fewer fees, but they use savings that might be needed for repairs or emergencies. Home equity financing can also involve additional risks. Calculate the monthly payment beside your expected energy savings, not alone. My own estimates became less convincing after including insurance, inverter replacement, and seasonal production changes. That was useful. The first spreadsheet was too optimistic.
Comparing solar quotes starts with a common unit: price per installed watt. Berkeley Lab’s Tracking the Sun 2024 report found a median residential price of about $3.10 per watt in 2023, before incentives. A 6-kilowatt system would therefore cost roughly $18,600 at that benchmark. Prices can differ because of roof access, electrical upgrades, permits, and local labor. Request each installer’s system size, estimated annual production, equipment warranties, labor coverage, and expected completion date. Cheap quotes often hide useful details.
My first comparison mistake was focusing only on the lowest total price. The better question is how much electricity each system should produce. For example, a 6-kilowatt array producing 7,800 kilowatt-hours annually gives an initial yield of 1,300 kilowatt-hours per kilowatt. The National Renewable Energy Laboratory commonly models photovoltaic degradation near 0.5% annually, so production should decline gradually. Calculate lifetime value by multiplying yearly output by your avoided electricity rate, then subtracting financing costs, maintenance, and future repairs. Include battery replacement separately. Some proposals assume electricity prices rise quickly, which can make savings look impressive but uncertain. Ask for a flat-rate scenario too. The International Energy Agency reports that solar remains among the lowest-cost new electricity sources globally, yet household value still depends heavily on shading, export rules, and local tariffs. Numbers need questioning.
| Comparison Dimension | Typical Planning Range or Example | How to Evaluate It | Long-Term Value Impact |
|---|---|---|---|
| System size | A typical home may require approximately 4–10 kW, depending on electricity use, roof conditions, and sunlight. | Check whether the proposed annual production matches historical electricity consumption rather than relying only on system size. | An oversized system may increase upfront cost without creating equal bill savings. |
| Solar panel capacity | Modern residential panels commonly provide about 350–450 watts each. | Compare total system capacity in kilowatts, not only the number of panels. | Higher-wattage panels can reduce roof area requirements, but they may not provide the lowest total project cost. |
| Installed solar cost | Approximately $2.50–$4.50 per watt before incentives is a useful preliminary U.S. comparison range. | Multiply the quoted price per watt by the system’s DC capacity and confirm whether permitting, labor, design, and interconnection are included. | For a 6 kW system, this range equals roughly $15,000–$27,000 before applicable incentives or financing costs. |
| Expected annual production | Approximately 1,200–1,600 kWh per kW per year in many U.S. locations; a 6 kW system may produce about 7,200–9,600 kWh annually. | Request the production estimate in kWh and review assumptions for roof direction, shading, tilt, weather, and system losses. | Production, not panel count, is the key input for estimating bill savings and payback. |
| Electricity value | Use the household’s actual utility rate; an example calculation may use $0.18 per kWh. | Review energy charges, fixed charges, time-of-use rates, and the utility’s export-credit rules. | Higher electricity prices generally increase the value of solar electricity used in the home. |
| Estimated first-year bill savings | Formula: annual solar production × value per kWh. Example: 8,400 kWh × $0.18 = approximately $1,512 per year before other adjustments. | Separate avoided electricity purchases from credits for excess electricity exported to the grid. | Actual savings depend on self-consumption, rate structure, weather, and utility policies. |
| Battery storage cost | Residential installed battery pricing commonly falls near $800–$1,200 per usable kWh, with substantial regional variation. | Compare usable capacity, continuous power output, round-trip efficiency, warranty period, backup-load coverage, and installation costs. | A battery may improve backup resilience and increase solar self-consumption, but it can lengthen the financial payback period. |
| Roof and electrical upgrades | Potential additional costs include roof repairs, service-panel upgrades, trenching, main-breaker work, and difficult-access charges. | Require every assumed upgrade to be listed as a separate line item in the quote. | Unlisted site work is a common reason that the final project price exceeds the initial estimate. |
| Operations and maintenance | Solar photovoltaic systems generally have low routine maintenance needs; occasional inspection, monitoring, or cleaning may be required. | Check monitoring access, workmanship coverage, inverter coverage, and the process for service calls. | Lower ongoing costs improve lifetime value, while difficult service arrangements can reduce it. |
| Panel degradation | Many modern panels are warranted to lose roughly 0.25%–0.50% of output per year. | Compare the guaranteed output at year 25 or year 30 rather than comparing only the initial wattage. | Slower degradation can produce more cumulative electricity over the system’s life. |
| Expected service life | Solar panels commonly operate for 25–35 years; inverters and batteries may require replacement sooner. | Ask for separate expected lives and replacement assumptions for panels, inverters, batteries, and monitoring equipment. | Replacement costs should be included in a realistic long-term cash-flow model. |
| Financing cost | The total financed amount may be substantially higher than the cash price after interest, dealer fees, and origination charges. | Compare cash price, APR, loan term, monthly payment, total of payments, fees, and any balloon or re-amortization provisions. | A lower monthly payment does not necessarily mean a lower total project cost. |
| Simple payback period | Formula: net upfront cost ÷ first-year savings. Example: $21,000 ÷ $1,512 ≈ 13.9 years before degradation, rate changes, maintenance, and financing. | Use the same cost basis and savings assumptions when comparing quotes. | Simple payback is useful for screening but does not account for the time value of money or future replacement costs. |
| Net present value and lifetime value | Include annual savings, degradation, utility-rate changes, maintenance, replacement costs, incentives, financing, and a discount rate over 25–30 years. | Compare the estimated present value of all benefits with the present value of all costs. | A quote with a higher initial price can provide greater lifetime value if it produces more energy or has lower long-term costs. |
| Quote quality checklist | A complete quote should identify system size, annual production, equipment specifications, labor, permits, interconnection, warranties, payment schedule, and exclusions. | Request at least three itemized quotes using the same assumptions and compare them line by line. | Transparent, itemized quotes make it easier to identify hidden costs and compare value fairly. |
Planning note: The figures above are general U.S. residential planning ranges, not guaranteed prices. Actual costs and savings vary by location, roof design, electricity rates, permitting requirements, shading, incentives, financing terms, and utility export policies.
Review electricity bills from the past 12 months. Calculate your average monthly usage in kilowatt-hours. A home using 900 kWh monthly needs more capacity than one using 500 kWh.
Divide annual electricity use by peak sun hours and system efficiency. For example, 10,800 kWh divided by 1,400 hours and 80% efficiency equals about 9.6 kW. It is only an estimate.
Roof direction, chimney shade, temperature, and local weather can reduce production. Older wiring may also require upgrades. Online calculators can feel too optimistic.
Yes. Include likely loads such as an electric vehicle or heat pump. Measure usable roof space before selecting panel quantities. Leave clear access for maintenance.
Request itemized pricing for equipment, labor, permits, and electrical upgrades. Ask whether optional battery storage is included. Hidden details matter.
Compare the price per installed watt. A 6 kW system at $3.10 per watt would cost about $18,600 before incentives. Prices vary with roof access and local labor.
No. Compare expected annual production, warranties, labor coverage, and completion dates. A low total price may hide missing services. Cheap is not automatically better.
Multiply annual energy production by your avoided electricity rate. Then subtract financing costs, maintenance, and future repairs. Consider battery replacement separately.
Production may decline gradually, around 0.5% annually in common planning models. A 6 kW system producing 7,800 kWh yearly starts near 1,300 kWh per kilowatt. Actual results may differ.
Ask for a flat electricity-price scenario, not only rising-price projections. Check shading, export rules, and local tariffs. Numbers need questioning.
Understanding how much do solar panels cost requires more than looking at the price of the panels themselves. Total expenses depend on factors such as system size, equipment quality, roof condition, installation complexity, local labor rates, and whether batteries or electrical upgrades are needed. Estimating household energy use and available sunlight can help determine the right system size and create a more realistic budget.
Solar installation costs may include panels, inverters, mounting equipment, permits, inspections, labor, monitoring, and future maintenance. Incentives, rebates, tax benefits, and financing options can reduce the upfront price, although interest and loan terms may affect the total amount paid over time. When comparing quotes, homeowners should review warranties, projected energy production, equipment specifications, and all included fees. Evaluating expected savings, electricity-rate changes, maintenance needs, and the system’s payback period provides a clearer view of its long-term value.

GAF Solar